
DNA Analyzer (Genetic Analyzer): How Capillary Electrophoresis Reads DNA, Parts, and Uses

On this page
A single fluorescent snapshot inside a DNA analyzer captures thousands of DNA fragments streaming past a laser, each glowing one of four colors. From that stream of colored flashes the instrument reconstructs the exact order of bases in a gene, or the precise lengths of the fragments that make up a forensic DNA profile. The physics that makes this possible is deceptively simple: push DNA through a thin gel-filled tube with an electric field, and the fragments sort themselves by size. Everything a DNA analyzer does rests on that one idea.
A DNA analyzer, also called a genetic analyzer or DNA sequencer, is an automated instrument that separates and detects DNA fragments by size using capillary electrophoresis. It replaces the slow, error-prone manual gels once used for the same job, processing many samples at once with less hands-on handling and a lower risk of cross-contamination. The same instrument performs two related but distinct tasks: DNA sequencing (reading the order of bases) and fragment analysis (measuring the sizes of labeled fragments, as in STR profiling).
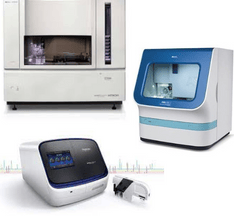 Figure: Different commercially available DNA analyzer
Working Principle of DNA Analyzer
A DNA analyzer separates DNA fragments by size using capillary electrophoresis, then identifies them by the fluorescent color they carry. The separation and the detection are two separate steps, and understanding the instrument means keeping them distinct.
Separation by size. Each capillary is a thin glass tube filled with a flowable polymer that acts as a molecular sieve. The sample is injected at the cathode (negative) end. Because DNA carries a net negative charge from its phosphate backbone, applying a high voltage drives the fragments through the polymer toward the anode (positive) end. Smaller fragments move through the sieve faster than larger ones, so the fragments arrive at the detector in order of increasing size. This size-based separation is the heart of the instrument, and it is identical whether the run is a sequencing reaction or a fragment analysis.
Detection by fluorescent color. Near the anode end, each fragment passes a detection window where a laser excites the fluorescent dye attached to it. The dye emits light at a longer wavelength than the laser. This emitted light passes through a diffraction grating that spreads it by wavelength onto a CCD (charge-coupled device) detector, so the instrument records both when a fragment arrives (its size) and what color it is (which dye it carries). Plotting dye signal against time produces the electropherogram, a series of colored peaks.
Where the two applications differ: the chemistry. What the colors mean depends on which job the instrument is doing.
In Sanger sequencing, the four DNA bases are labeled with four different fluorescent dyes carried on dideoxynucleotide terminators (ddNTPs). Each time a ddNTP is incorporated, the growing DNA strand stops, producing a nested set of fragments that differ in length by one base, each ending in a dye that identifies its final base. As these fragments pass the detector shortest to longest, the sequence of colors is read off directly as the sequence of bases. A size standard run alongside lets the software assign each peak to a position.
In fragment analysis (for example STR profiling in forensics, or SNP genotyping), the DNA is not read base by base. Instead, target regions are amplified with dye-labeled primers, and the instrument measures the precise size of each labeled fragment against an internal size standard. Software compares those sizes to an allelic ladder to assign an allele at each locus. Here the color identifies which marker a fragment belongs to, and the arrival time gives its size, but no base sequence is read.
An electropherogram, then, is a plot of fluorescence against fragment size (or migration time). In sequencing it is read as a run of single-base peaks; in fragment analysis it is read as sized peaks matched to known alleles.
Reading the electropherogram
The electropherogram is where a DNA analyzer run is actually interpreted, and where most things visibly go wrong. A clean sequencing trace shows evenly spaced, single-color peaks, one clear base per position. A clean fragment-analysis trace shows sharp peaks sitting at defined sizes against the size standard. Learning to read the departures from clean is what separates running the instrument from understanding it.
A few common patterns and what they mean:
- A position with two overlapping peaks of different colors in a sequencing trace usually means the template was not pure, two sequences are being read at once, or a genuine heterozygous base is present. Context decides which.
- Broad, messy peaks or a rising baseline often mean too much sample was loaded or the polymer or capillary is degraded. Overloading saturates the detector and blurs the size resolution.
- Dye blobs (unincorporated dye peaks), broad humps early in the run, come from failure to remove leftover labeled terminators before the run. They can mask real early peaks.
- Pull-up peaks, small peaks of one color appearing directly under a strong peak of another, mean the color separation (spectral calibration) is off, so one dye is bleeding into another's channel.
- A flat or failed trace with a normal size standard points to a problem with the sample or the sequencing reaction, not the instrument. If the size standard also fails, suspect the run, the capillary, or the injection.
The single most useful habit: always check the size standard first. If the size standard ran cleanly, the instrument and separation worked, and any problem is in the sample. If the size standard is wrong, no allele call or base call from that capillary can be trusted.
Parts of DNA Analyzer
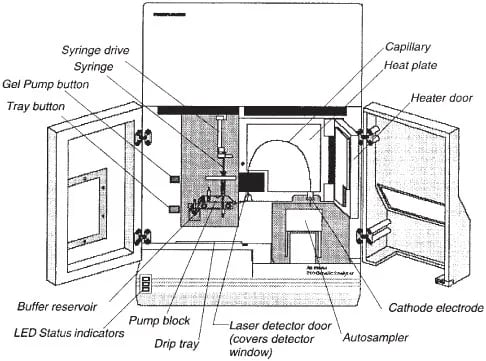 1. Door: There are two doors in the DNA analyzer; the oven door and the instrument door. The oven door is on the inner part of the instrument. The outer part of the instrument has a door with glass.
2. Power button: It is present in the outermost part of the DNA analyzer, and it helps turn the equipment on or shut it down.
3. LED indicators: These indicate if the machine is running or not and are present just beside the power button.
4. Polymer pouch/reservoir: It provides the desired polymer for the experiment.
5. Polymer delivery pump: It is connected to the polymer reservoir and anode buffer container via a polymer supply tube and interconnected tube, respectively. It pumps polymer into the array.
6. Pump block: It consists of a syringe fitting array, water seal, piston, pump chamber, and water trap. Its function is to control the polymer delivery pump.
7. Lower polymer block: It consists of a buffer valve. It is connected to the anode buffer container and polymer delivery pump and functions as a controller of the anode flow from the container.
8. Capillary array: A replaceable unit containing multiple capillaries (commonly 4, 8, 16, 24, or 96, depending on the instrument) that separates the fluorescently labeled DNA fragments by electrophoresis.
9. Heat plate: It helps in maintaining constant capillary array temperature.
10. Autosampler: It holds the cathode buffer reservoir and sampling plate. It helps appropriately align the container and the cathode buffer reservoir without human intervention.
11. Cathode Buffer reservoir: It consists of 1✕ running buffer for supporting electrophoresis and helps maintain constant fluid height during the experiment.
12. Waste reservoir: It collects discarded waste like buffers, water, and polymers after the completion of the experiment.
13. Water reservoir: Holds deionized water used to rinse capillaries and the pump system between runs.
Extra accessories
- Computer software: The type, version, and operation of the computer software depending on the company manufacturing the DNA analyzer.
- Sample plate: A 96-well (or 384-well) plate holds the prepared samples for automated injection by the autosampler.
Operating Genetic Analyzer
For operating a DNA analyzer, calibration and proper setup are essential. Following are the steps for calibrating and setting up a DNA analyzer:
Calibrating a DNA Analyzer
Two types of calibration are done in DNA analyzer; spatial and spectral.
- Spatial calibration: This maps the physical position of each capillary to the correct location on the CCD detector, so the signal from each capillary is read from the right pixels. It is performed when the capillary array is installed or replaced, when the array window is moved, and after the instrument is relocated. It does not involve reinstalling software.
- Spectral calibration: This teaches the software to separate the overlapping emission colors of the different dyes, so signal from one dye is not misread as another (the cause of pull-up peaks). It is performed when a new dye set is used, after the laser or CCD is serviced, when the capillary array is changed, or when pull-up or color problems appear. A calibration standard is run through each capillary, and the software accepts or rejects the resulting color matrix for each one.
Setting Up the Instrument
- Select the desired capillary array and place the capillary array inside the instrument. Perform spatial calibration after proper placement.
- Then select the desired polymer and place the polymer pouch in the instrument. Make sure the amount of polymer is enough for the complete cycle.
- To fill the water and buffer reservoir, bring the autosampler to the forward position, slowly dissemble each container and discard any remaining fluid. Slowly fill 80 ml of the buffer and water in the respective container after thorough rinsing (first with deionized water and then buffer/water, respectively) and cleaning using lint-free clothes. Place the buffer in the respective tray, close the instrument door and push the tray button to move the autosampler to the correct position.
- Filling anode buffer jar: Unscrew the jar and clean it with deionized water. Rinse again using the anode buffer. Then fill the 67 ml of anode buffer in the jar. Ensure the electrode is immersed inside the jar when screwing the jar back into the instrument.
Steps to Operate DNA Analyzer
Once the parts and instrument of the DNA analyzer are set up correctly and the required calibration is performed, the following steps are performed to run a successful sequencing cycle:
- Firstly assemble the plate correctly.
- Then insert the plate inside the instrument.
- Open the software on the computer and schedule a run for desired date and time.
- Run the sequencing cycle. The DNA sequencing time depends on the type of sequencing performed; for example, a long read DNA sequencing can run for 120 minutes, and standard read DNA sequencing can run for 60 minutes.
- Real-time, run data history and electropherogram can be viewed during or after the completion of the sequencing cycle.
Uses of Genetic Analyzer
The DNA analyzer is a modern and advanced helpful equipment for performing DNA analysis in a different laboratory. It supports both sequencing applications (Sanger sequencing, gene mutation and variant analysis) and fragment analysis applications (STR profiling, SNP genotyping, and other sizing assays). The following are the area of application of the DNA analyzer:
- Forensic science: Forensic DNA profiling relies on STR fragment analysis, where the instrument sizes labeled fragments to build a DNA profile. Automating this on a genetic analyzer speeds the work and reduces the chance of cross-contamination compared with manual gels.
- Microorganism-related research laboratories: Gene analysis of bacteria and viruses is usually a choice while researching microorganisms. So, a DNA analyzer can be an ideal substitute for tedious manual work.
- Cancer-related laboratories: The DNA analyzer helps detect genetic mutation and will be helpful in cancer-related laboratories for diagnosing the root cause of cancer.
Benefits of DNA Analyzer
- Large quantity of sample processing: Depending on the capillary array, the instrument can process many samples in parallel (up to 96 on high-throughput models), so it helps in processing a large amount of the samples.
- Less time-consuming: Since it can process multiple samples and require significantly less manual work, it will consume less time. Likewise, it is an automated process; a worker can finish other manual labor when the machine runs in the background.
- More efficient: DNA analyzers require only trained human resources to obtain results from at least 48 samples in very little time. So it increases the efficiency of laboratories.
- Less cross-contamination: Since sample handling is automatic, the chance of cross-contamination is significantly less or even nil.
How to Remember
Small runs fast, big lags behind. In the capillary, tiny fragments slip through the polymer sieve quickest and hit the detector first. Fragments arrive shortest to longest. If you remember the order of arrival, you remember how the size ladder works.
Four bases, four colors, one at a time. In Sanger sequencing each base wears a different dye, and the strand stops the moment a dyed terminator goes on. The instrument just reads the colors in the order they arrive. Sequence of colors equals sequence of bases.
Sequencing reads letters; fragment analysis measures lengths. The same machine, two jobs. Sequencing asks "what is the order of bases?" Fragment analysis asks "how long is this piece?" Forensic STR profiling is the second one, never call it sequencing.
Check the size standard first. The one-line troubleshooting habit. Size standard clean means the machine worked and the fault is in the sample. Size standard broken means don't trust anything from that capillary.
Spatial = where, spectral = color. Two calibrations, two jobs. Spatial calibration finds where each capillary sits on the detector. Spectral calibration untangles which color is which. Pull-up peaks are a spectral problem.
Key exam facts in one table
| Concept | Fact to remember |
|---|---|
| Core principle | Capillary electrophoresis separates DNA fragments by size in a polymer-filled capillary under high voltage |
| Direction of migration | DNA is negatively charged; injected at the cathode end, migrates toward the anode; small fragments arrive first |
| Detection | Laser excites the fluorescent dye on each fragment; a diffraction grating spreads the emission by wavelength onto a CCD |
| Sequencing chemistry | Sanger method: four dye-labeled dideoxy terminators (ddNTPs); color order read as base order |
| Fragment analysis | Dye-labeled fragments sized against an internal size standard; alleles assigned from an allelic ladder (STR, SNP) |
| Sequencing vs fragment analysis | Sequencing reads base order; fragment analysis measures fragment size. Forensic STR profiling is fragment analysis, not sequencing |
| Output | Electropherogram: fluorescence plotted against size or migration time, as colored peaks |
| Spatial calibration | Maps each capillary's position to the CCD; done on array install or instrument move |
| Spectral calibration | Separates overlapping dye colors; prevents pull-up peaks; done on new dye set or after laser/CCD service |
| First troubleshooting check | Always verify the internal size standard before trusting any base call or allele call |
Where Students Get Confused
"A DNA analyzer sequences DNA." Sometimes. It does two different jobs: sequencing (reading base order by the Sanger method) and fragment analysis (measuring fragment sizes for STR or SNP work). Forensic DNA profiling is fragment analysis, not sequencing, even though both run on the same instrument.
Where the fluorescent dye comes from. In modern Sanger sequencing the dye is on the dideoxy terminators (ddNTPs), one color per base, added as the strand stops. It is not simply a single labeled primer. In fragment analysis the dye is on the primers used to amplify each marker.
Smaller fragments arrive first, not last. The polymer sieves by size, and small fragments move fastest. Students sometimes assume big, heavy fragments lead; the opposite is true.
Spatial versus spectral calibration. Spatial finds where each capillary maps onto the detector. Spectral separates the dye colors. They fix different problems: a spatial error misreads which capillary a signal came from; a spectral error causes pull-up, where one dye bleeds into another's channel.
The electropherogram is size, not sequence, by default. It is a plot of fluorescence against fragment size or migration time. Only in a sequencing run does the peak order translate directly into a base sequence; in fragment analysis the peaks are sized alleles.
References
- Brown TA. Genomes 5. 5th ed. Boca Raton: CRC Press; 2023. (Sanger dideoxy sequencing chemistry and DNA analysis)
- Applied Biosystems. 3730/3730xl DNA Analyzer User Guide. Thermo Fisher Scientific. Available at: https://assets.thermofisher.com/TFS-Assets/LSG/manuals/cms_041259.pdf
- Buckingham L. Molecular Diagnostics: Fundamentals, Methods, and Clinical Applications. 4th ed. Philadelphia: F.A. Davis; 2026.
Frequently Asked Questions
What is the working principle of a DNA analyzer?
What is the working principle of a DNA analyzer?
It separates DNA fragments by size using capillary electrophoresis. Fragments are injected at the cathode end of a polymer-filled capillary and driven by high voltage toward the anode; smaller fragments move faster and reach the detector first. A laser excites a fluorescent dye on each fragment, and a CCD records the color and arrival time, producing an electropherogram.
What is the difference between DNA sequencing and fragment analysis on a genetic analyzer?
What is the difference between DNA sequencing and fragment analysis on a genetic analyzer?
Sequencing reads the order of bases in a DNA strand, using four dye-labeled dideoxy terminators so the color order equals the base order. Fragment analysis does not read bases; it measures the precise sizes of labeled fragments against a size standard, as in STR profiling or SNP genotyping. The same instrument and the same size separation serve both, but the chemistry and the readout differ.
Why do smaller DNA fragments move faster in capillary electrophoresis?
Why do smaller DNA fragments move faster in capillary electrophoresis?
The capillary is filled with a polymer that acts as a molecular sieve. Smaller fragments navigate the polymer network more easily and migrate faster, so they reach the detector before larger fragments. This is why fragments arrive in order of increasing size.
What is an electropherogram?
What is an electropherogram?
It is the output plot of a DNA analyzer: fluorescence intensity plotted against fragment size or migration time, shown as a series of colored peaks. In a sequencing run the peak colors are read as the base sequence; in fragment analysis the peaks are sized and matched to known alleles.
What is the difference between spatial and spectral calibration?
What is the difference between spatial and spectral calibration?
Spatial calibration maps the physical position of each capillary to the correct pixels on the CCD detector, and is done when the array is installed or the instrument is moved. Spectral calibration teaches the software to separate the overlapping emission colors of the dyes, preventing one dye from being misread as another (pull-up), and is done when a new dye set is used or after the laser or detector is serviced.
Why check the size standard before interpreting a result?
Why check the size standard before interpreting a result?
The internal size standard runs in every capillary and confirms that separation and detection worked. If the size standard is clean, the instrument performed correctly and any problem lies in the sample. If the size standard is wrong or missing, no base call or allele call from that capillary can be trusted.

Tankeshwar Acharya, MSc (Medical Microbiology)
Tankeshwar Acharya is an Assistant Professor in the Department of Microbiology at Patan Academy of Health Sciences (PAHS), Nepal, where he has been teaching and practicing clinical microbiology for over 14 years. He is the founder of Microbe Online, one of the leading free microbiology education resources on the web, covering bacteriology, mycology, parasitology, immunology, and clinical laboratory diagnostics written from direct experience in both the classroom and the diagnostic laboratory.
Comments
No comments yet. Be the first to share your thoughts.
Leave a comment
All comments are reviewed before they appear.