
Spectrophotometer: Principle, Parts, and Lab Uses (OD600)

On this page
The most common measurement in the lab isn't measuring what its name says
Every microbiology lab reads bacterial growth the same way: put the culture in a spectrophotometer, read the optical density at 600 nm, and track the number as the culture grows. It is probably the single most repeated measurement in the field.
But the instrument is called an absorbance meter, and at 600 nm the bacteria are barely absorbing any light at all. What they are doing is scattering it, bouncing the beam away from the detector so that less light reaches it. The instrument reports that lost light as "absorbance," even though almost none of it was truly absorbed. That is why an OD600 reading is a measure of turbidity, not absorption, why the same culture can read differently on two different machines, and why the number goes non-linear once the culture is dense enough that light scatters more than once on its way through.
Understanding a spectrophotometer means understanding this distinction, between light that is absorbed and light that is merely lost, and knowing which one you are actually measuring. The Beer-Lambert law, the choice of wavelength, the quartz cuvette, the blank: each exists to make sure the number on the display means what you think it means. The sections below build that understanding from the physics up.
A spectrophotometer is an analytical instrument that measures how much light a sample absorbs at a specific wavelength. By detecting the intensity of light before and after it passes through a solution, it can determine the concentration of a substance; making it one of the most widely used instruments in microbiology, biochemistry, and clinical laboratories.
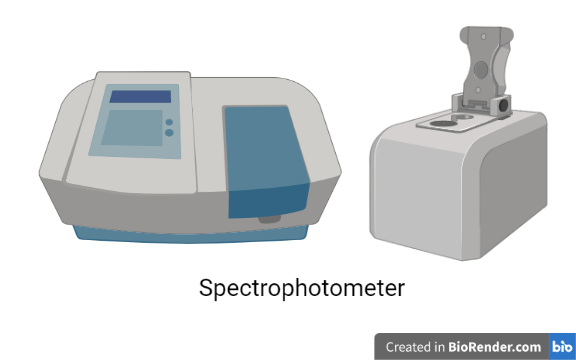 The word "spectrophotometer" combines two devices: a spectrometer (which produces light of a specific wavelength) and a photometer (which measures light intensity). Together, they allow precise, quantitative analysis of biological and chemical samples.
Principle of spectrophotometer
The spectrophotometer works on the Beer-Lambert Law, which establishes a direct relationship between the concentration of a solution and the amount of light it absorbs.
Beer-Lambert Law
A = εCL
Where:
- A = Absorbance (the amount of light absorbed by the sample)
- ε = Molar extinction coefficient (a constant specific to each substance at a given wavelength)
- C = Concentration of the sample (mol/L)
- L = Path length of light through the sample (usually 1 cm in a standard cuvette)
In simple terms: the more concentrated a solution, the more light it absorbs. Double the concentration, double the absorbance.
Transmittance and absorbance
Transmittance (T) is the fraction of light that passes through the sample:
T = I_t / I_o
Where I_t = transmitted light intensity and I_o = incident (original) light intensity.
Absorbance is the negative logarithm of transmittance:
A = −log(T) = −log(I_t / I_o)
This logarithmic relationship is important: a solution with 10% transmittance has an absorbance of 1.0, while a solution with 1% transmittance has an absorbance of 2.0.
Why this matters in the lab
Since the path length (L) is known (typically 1 cm in a standard cuvette) and the molar extinction coefficient (ε) is a constant for a given substance at a given wavelength, the only unknown in the Beer-Lambert equation is concentration (C). By measuring absorbance, you can directly calculate concentration:
C = A / εL
This is the basis of all spectrophotometric quantification — from measuring DNA concentration to determining bacterial growth.
Limitations of Beer-Lambert Law
The Beer-Lambert Law holds true only under certain conditions. It breaks down when:
- Concentration is too high (above ~0.01 M), causing molecular interactions that alter absorbance
- The light source is not truly monochromatic
- The sample is turbid (scatters light rather than absorbing it)
- The solute undergoes chemical changes (dissociation, reaction) at different concentrations
Parts of a spectrophotometer
A standard spectrophotometer has five major components that work in sequence to measure absorbance.
1. Light source
The light source provides a broad spectrum of light that the monochromator then narrows to a specific wavelength. Different lamps are used depending on the wavelength range needed:
| Light source | Wavelength range | Application |
|---|---|---|
| Tungsten (incandescent) lamp | 320–2500 nm | Visible light measurements |
| Deuterium lamp | 190–400 nm | Ultraviolet measurements (Standard UV source) |
| Xenon lamp | 200–1000 nm | Broad spectrum; UV-Visible |
| Nernst filament / Globar | 2,500–50,000 nm | Infrared measurements |
Most routine laboratory spectrophotometers use a deuterium-tungsten combination to cover both UV (190–400 nm) and visible (400–700 nm) ranges.
2. Monochromator (optical system)
The monochromator isolates a single wavelength (or a narrow band) of light from the broad spectrum produced by the light source. It consists of several components working in sequence:
- Entrance slit: narrows the incoming light into a thin beam
- Collimator lens: converts the diverging light into parallel rays
- Dispersive device (prism or diffraction grating): separates the parallel light into its individual wavelengths
- Exit slit: selects only the desired wavelength to pass through to the sample
Prism vs. diffraction grating:
A prism separates wavelengths by refraction — different wavelengths bend at different angles as they pass through the glass. However, the separation is not linear (UV wavelengths are more widely spread than visible ones).
A diffraction grating consists of thousands of parallel grooves ruled on a polished surface (typically aluminum), usually 1,200–3,600 grooves/mm for visible and UV light. It separates wavelengths by diffraction and produces a more linear, uniform spread of wavelengths. For this reason, diffraction gratings are preferred in modern spectrophotometers over prisms.
For measurements below 350 nm (UV range), quartz or fused silica must be used for all optical components — regular glass absorbs UV light and would make the instrument useless in that range.
3. Sample holder (cuvette)
The cuvette holds the solution being measured. It sits in the light path between the monochromator and the detector.
Key features of cuvettes:
- Uniform optical path length of exactly 1 cm — this is the "L" in the Beer-Lambert equation
- Made of glass (for visible light, 340–2500 nm) or quartz/fused silica (for UV light, 190–340 nm)
- Plastic cuvettes are available for single-use visible-light measurements
- Must be handled carefully — fingerprints, scratches, and bubbles all interfere with readings
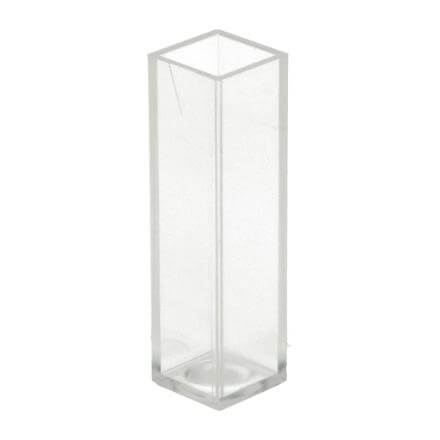 Figure: A standard 1 cm optical-path cuvette
Important: turbidity readings are unreliable when the culture medium itself scatters or absorbs light. Blood-containing broths, for example, give falsely high readings because red blood cells and medium components scatter the beam independently of bacterial growth. For optical density work, grow the organism in a clear broth, and always blank against the same uninoculated medium.
4. Detector (photometer)
After light passes through the sample, the detector measures how much light remains. It converts light energy into an electrical signal proportional to light intensity.
Common detector types:
- Photoelectric cell (photocell): produces a current proportional to the intensity of incoming light; used in older, simpler instruments
- Photomultiplier tube (PMT): amplifies the signal from low-intensity light; used in UV spectrophotometers
- Photodiode array (PDA): detects multiple wavelengths simultaneously; used in modern diode array spectrophotometers
- Charge-coupled device (CCD): high sensitivity; used in advanced research instruments
5. Display/readout system
The electrical signal from the detector is processed and displayed as either absorbance (A) or percentage transmittance (%T). Modern spectrophotometers display readings digitally and many are connected to computers for data recording and analysis.
Working mechanism of spectrophotometer
The light path through a spectrophotometer follows this sequence:
Light source → Entrance slit → Collimator → Dispersive device → Exit slit → Sample (cuvette) → Detector → Display
Step by step:
- The light source emits a broad spectrum of light across multiple wavelengths
- The entrance slit narrows the light into a thin, controlled beam
- The collimator converts the diverging beam into parallel rays
- The dispersive device (grating or prism) separates the parallel light into individual wavelengths
- The exit slit selects only the desired wavelength — this is called monochromatic light
- The monochromatic light enters the cuvette containing the sample solution
- Within the cuvette, some light is absorbed by the sample, some is reflected, and the remainder is transmitted
- The transmitted light hits the detector, which converts it into an electrical signal
- The instrument calculates absorbance from the ratio of transmitted to incident light and displays the result
Single beam vs. double beam
In a single beam spectrophotometer, the blank (reference) solution and the sample solution are read separately, one after the other, in the same cuvette position. The blank is read first to set the baseline (zero absorbance), then the sample is read.
In a double beam spectrophotometer, the monochromatic light is split into two beams by a beam splitter (half-mirror). One beam passes through the reference solution and the other through the sample simultaneously. This eliminates errors caused by fluctuations in the light source and is more accurate for continuous measurements.
Types of spectrophotometer
Based on wavelength range
| Type | Wavelength range | Light source | Cuvette material |
|---|---|---|---|
| UV spectrophotometer | 190–400 nm | Deuterium or hydrogen lamp | Quartz/fused silica |
| Visible spectrophotometer | 400–700 nm | Tungsten lamp | Glass or plastic |
| UV-Visible spectrophotometer | 190–700 nm | Deuterium + tungsten | Quartz |
| Infrared (IR) spectrophotometer | 700–50,000 nm | Globar or Nernst filament | Salt crystals (NaCl, KBr) |
Based on beam design
Single beam spectrophotometer:
- Simpler design, lower cost
- Typically operates across the UV-visible range (many models 190 to 1000 nm; simpler visible-only models 325 to 1000 nm)
- Blank and sample read sequentially
- Susceptible to light source fluctuations
Double beam spectrophotometer:
- More complex, higher cost
- Operates between 185–1000 nm
- Blank and sample read simultaneously
- More stable and accurate for prolonged measurements
Based on detection system
Scanning spectrophotometer: measures absorbance at one wavelength at a time; produces a full spectrum by scanning through wavelengths
Diode array spectrophotometer (photodiode array): contains multiple detectors that measure all wavelengths simultaneously; produces a full spectrum in seconds; ideal for kinetic studies
Fluorescence spectrophotometer (spectrofluorometer): measures fluorescence emission rather than absorbance; used for DNA quantification (ethidium bromide, SYBR Green), protein assays (tryptophan fluorescence), and immunofluorescence
Atomic absorption spectrophotometer (AAS): measures the absorption of light by free atoms in the gas phase; used to detect trace metals like iron, zinc, copper, and lead in biological samples
Uses of spectrophotometer in microbiology and biochemistry
1. Measuring bacterial growth (OD600)
The most common microbiology application. Bacterial cultures are turbid (cloudy) — the more bacteria present, the more light is scattered. By measuring optical density at 600 nm (OD600), you can monitor bacterial growth over time without killing the cells. An OD600 of 0.1–0.4 typically indicates early log phase; OD600 above 1.0 indicates late log or stationary phase.
2. DNA and RNA quantification
Nucleic acids absorb UV light at 260 nm due to their nitrogenous bases. A spectrophotometer can determine the concentration of DNA or RNA from a sample in seconds. The A260/A280 ratio is used to assess purity — a ratio of ~1.8 indicates pure DNA; ~2.0 indicates pure RNA. Contamination with protein (which absorbs at 280 nm) lowers this ratio.
3. Protein quantification
Several colorimetric protein assays rely on spectrophotometry:
- Bradford assay: protein binds Coomassie Blue dye; measured at 595 nm
- Lowry assay: measured at 750 nm
- BCA assay: measured at 562 nm
- Direct UV: aromatic amino acids absorb at 280 nm; used for pure protein solutions
4. Enzyme kinetics
Enzyme activity is measured by monitoring the rate at which a substrate is consumed or a product is formed. If either the substrate or product absorbs at a measurable wavelength, the rate of the reaction can be tracked in real time. A classic example is the lactate dehydrogenase (LDH) assay, which monitors NADH consumption at 340 nm.
5. Antibiotic susceptibility (MIC determination)
The minimum inhibitory concentration (MIC) of an antibiotic can be confirmed using spectrophotometry. After broth microdilution, wells with bacterial growth show higher turbidity (OD600) compared to wells where the antibiotic has inhibited growth.
6. Identification of compounds
Every molecule has a characteristic absorption spectrum — a "fingerprint" pattern of absorbance across wavelengths. By scanning across wavelengths and plotting an absorption spectrum, unknown compounds can be identified or confirmed.
7. Water and environmental testing
Spectrophotometry measures pollutants, nitrates, phosphates, heavy metals, and dissolved oxygen levels in water samples — critical for environmental microbiology and public health labs.
8. Clinical diagnostics
Used routinely in clinical laboratories to measure:
- Hemoglobin concentration (540 nm)
- Bilirubin levels (450 nm)
- Glucose concentration (enzymatic colorimetric assays)
- Uric acid, creatinine, cholesterol
Where students get confused
Optical density is scattering, not absorption. When you read a bacterial culture at OD600, the instrument displays "absorbance," but the bacteria are not absorbing that light. They are scattering it away from the detector. The instrument cannot tell the difference; it only knows less light arrived. This is why OD600 is really a turbidity measurement, why it is not a true Beer-Lambert absorbance, and why two spectrophotometers with different optical geometries can give different OD readings for the same culture. Treat OD600 as a reproducible index of cell density on one instrument, not an absolute physical constant.
Absorbance and transmittance move in opposite directions, and not linearly. Halving the transmitted light does not halve the absorbance. Because absorbance is the negative logarithm of transmittance, 10% transmittance is an absorbance of 1.0, and 1% transmittance is an absorbance of 2.0. A large drop in transmitted light corresponds to a small step in absorbance. Quantitative work uses absorbance precisely because it, not transmittance, is linear with concentration.
Why UV needs quartz, and glass does not "block a color." Glass is transparent to visible light but absorbs UV below about 340 nm. Put a glass cuvette in a UV measurement and the cuvette itself absorbs the light before it reaches the sample, giving a falsely high reading that reflects the glass, not the analyte. Quartz and fused silica are transparent through the UV range, which is why any measurement below 340 nm, DNA at 260 nm, protein at 280 nm, requires a quartz cuvette.
The blank is not just "zeroing the machine." The blank contains everything in the sample except the analyte: the solvent, the buffer, the cuvette itself, and any reagent color not due to the analyte. Blanking subtracts all of that background so the reading reflects only the substance you care about. Skipping or mismatching the blank (for example, blanking against water but reading a sample in buffered medium) folds the background into your result as falsely high absorbance.
A260/A280 direction. Protein absorbs at 280 nm, nucleic acid at 260 nm. Protein contamination therefore raises the 280 reading and lowers the ratio. Pure DNA sits near 1.8 and pure RNA near 2.0; a ratio well below 1.8 signals protein contamination, not the reverse. Students often remember that the ratio matters but forget which way contamination pushes it.
Keep absorbance between 0.1 and 1.0. Below 0.1 the signal is lost in noise; above 1.0 the Beer-Lambert relationship bends and concentration is underestimated. A reading of 1.5 is not "more accurate because it is bigger", it is outside the linear range and needs dilution and re-measurement.
Calibration and quality control
Calibration procedure
- Turn on the spectrophotometer and allow it to warm up for 10–15 minutes — this stabilizes the light source and prevents drift in readings
- Set the desired wavelength
- Fill a cuvette with blank solution (solvent only, without the analyte) and insert it into the sample holder
- Set the absorbance to zero (or transmittance to 100%) — this is called blanking or zeroing
- Replace the blank with your sample cuvette and record the absorbance
Selecting the correct wavelength
Always measure at the wavelength of maximum absorbance (λmax) for your analyte. At λmax, the relationship between absorbance and concentration is most sensitive and linear. Use a wavelength scan to identify λmax before performing quantitative measurements.
Quality control checks
- Use certified standard solutions to verify instrument accuracy at the start of each batch
- Check the cuvette for scratches, cloudiness, or deposits before each use
- Ensure the sample is within the linear range of the Beer-Lambert Law (absorbance between 0.1 and 1.0 is ideal)
- Do not use broth cultures older than 24 hours for turbidity measurements, as aged cultures may clump unevenly and scatter light inconsistently
Precautions and common errors
| Error | Cause | Prevention |
|---|---|---|
| False high absorbance | Fingerprints on cuvette | Always handle cuvettes by the top edges |
| False high absorbance | Bubbles in cuvette | Tap cuvette gently before inserting |
| Inaccurate readings | Wrong wavelength selected | Confirm λmax before measurement |
| Non-linear results | Sample too concentrated | Dilute the sample to bring A below 1.0 |
| Drift in readings | Instrument not warmed up | Allow 10–15 minutes warm-up time |
| False readings | Turbid sample in UV assay | Centrifuge or filter sample before measurement |
| Inaccurate UV readings | Using glass cuvette for UV | Use quartz cuvettes for wavelengths below 340 nm |
Frequently asked questions
What is the difference between a spectrophotometer and a colorimeter? A colorimeter uses fixed color filters and is limited to visible wavelengths (400–700 nm). A spectrophotometer uses a monochromator to select any wavelength across UV, visible, and IR ranges, making it far more versatile and precise. Colorimeters are simpler and cheaper; spectrophotometers are more accurate and suitable for research.
Why is 600 nm used for measuring bacterial growth? At 600 nm, bacteria scatter light rather than absorbing it, giving a reliable turbidity reading. More importantly, most biological pigments and culture media components do not absorb strongly at 600 nm, minimizing interference. The wavelength is also safe for comparison between labs, as OD600 is a universal standard in microbiology.
What does an A260/A280 ratio tell you? It indicates the purity of your nucleic acid preparation. Pure DNA has a ratio of ~1.8; pure RNA has a ratio of ~2.0. A lower ratio suggests protein contamination (proteins absorb strongly at 280 nm). A higher ratio may indicate RNA contamination in a DNA sample.
Why must quartz cuvettes be used for UV measurements? Regular glass absorbs UV light below 340 nm, preventing it from reaching the sample. Quartz and fused silica are transparent throughout the UV range (190–340 nm) and are therefore essential for any UV measurement. Using a glass cuvette in the UV range will give falsely high absorbance readings.
What is the ideal absorbance range for accurate measurements? The Beer-Lambert Law is most accurate when absorbance falls between 0.1 and 1.0. Below 0.1, the signal is too weak and noise becomes significant. Above 1.0, the relationship between absorbance and concentration becomes non-linear. If your sample gives an absorbance above 1.0, dilute it and re-measure.
Can a spectrophotometer measure colored and colorless compounds? Yes. Colored compounds absorb visible light and can be measured directly. Colorless compounds that absorb UV light (such as proteins at 280 nm and nucleic acids at 260 nm) can be measured in the UV range. Colorless compounds with no UV absorption require a colorimetric reaction — the analyte is reacted with a reagent to produce a colored product that can then be measured.
What is a blank and why is it necessary? The blank (or reference) solution contains everything in the sample except the analyte — typically just the solvent or buffer. It accounts for any light absorbed by the solvent, cuvette, or other non-analyte components. Without blanking, these background absorptions would be included in your sample reading, giving falsely high absorbance values.
What is the difference between absorbance and transmittance? Transmittance (%T) is the percentage of light that passes through the sample. Absorbance (A) is the logarithm of the reciprocal of transmittance: A = −log(T/100). They are inversely related — high transmittance means low absorbance. Most quantitative work uses absorbance because it has a linear relationship with concentration (Beer-Lambert Law), whereas transmittance does not.
Frequently Asked Questions
What is the Beer-Lambert Law?
What is the difference between a spectrophotometer and a colorimeter?
Why is 600 nm used for measuring bacterial growth (OD600)?
What does an A260/A280 ratio tell you?
Why must quartz cuvettes be used for UV measurements?
What is the ideal absorbance range?
What is a blank and why is it necessary?
Single beam vs double beam spectrophotometer?
References
- Skoog, D. A., Holler, F. J., & Crouch, S. R. (2018). Principles of Instrumental Analysis (7th ed.). Cengage Learning.
- Nelson, D. L., & Cox, M. M. (2021). Lehninger Principles of Biochemistry (8th ed.). W. H. Freeman.
- Tille, P. M. (2022). Bailey and Scott's Diagnostic Microbiology (15th ed.). St. Louis: Elsevier.
- Sambrook, J., & Russell, D. W. (2001). Molecular Cloning: A Laboratory Manual (3rd ed.). Cold Spring Harbor Laboratory Press.
- Thermo Fisher Scientific. (2023). NanoDrop Spectrophotometers: 260/280 and 260/230 Ratios. Technical Note.

Tankeshwar Acharya, MSc (Medical Microbiology)
Tankeshwar Acharya is an Assistant Professor in the Department of Microbiology at Patan Academy of Health Sciences (PAHS), Nepal, where he has been teaching and practicing clinical microbiology for over 14 years. He is the founder of Microbe Online, one of the leading free microbiology education resources on the web, covering bacteriology, mycology, parasitology, immunology, and clinical laboratory diagnostics written from direct experience in both the classroom and the diagnostic laboratory.
Comments
No comments yet. Be the first to share your thoughts.
Leave a comment
All comments are reviewed before they appear.