
Agarose Gel Electrophoresis: Principle, Procedure, Results
Agarose gel electrophoresis separates DNA fragments from 100 bp to 25 kb by size. Learn the principle, how to cast and run a gel, why supercoiled plasmid runs faster than linear DNA, and how to read a PCR gel against a DNA ladder.
You have run a PCR. The tube looks exactly as it did before: clear and colorless. PCR gives you no result you can see. To find out whether the reaction amplified anything, and whether it amplified a product of the right size, you run it on an agarose gel.
Load four lanes: a DNA ladder, your sample, a positive control, and a negative control. An hour later, under the transilluminator, the gel answers three separate questions at once.
- The negative control must be empty. A band here means contamination, and nothing else on the gel can be trusted.
- The positive control must show a band at the expected size. If it does not, the reaction failed, and a blank sample lane means nothing.
- Only then do you read the sample lane, against the ladder, which converts the band's height into a number of base pairs.
That is what an agarose gel does. It turns an invisible mixture of DNA fragments into a pattern you can photograph and measure. Everything below, the agarose percentage, the buffer, the loading dye, the ladder, exists so that the height of a band can be trusted to mean a size.
What is agarose gel electrophoresis?
Agarose gel electrophoresis separates DNA fragments by size. DNA carries a negatively charged phosphate backbone, so in an electric field every fragment moves toward the positive electrode (the anode). Because charge and mass increase together along a DNA molecule, all fragments feel the same pull per unit mass, and the only thing separating them is how easily they thread through the pores of the agarose mesh. Smaller fragments travel further. Larger fragments lag behind. Migration distance is inversely proportional to the logarithm of fragment size, so a fragment of unknown length can be sized by comparing its position against a DNA ladder run alongside it.
Agarose gel electrophoresis is one of the most common electrophoresis techniques. It is simple to perform and yet has great resolving power. The agarose gel consists of microscopic pores that act as a molecular sieve, separating molecules according to their size and shape as they are drawn through the mesh by an electric field.
It is used routinely to analyze DNA fragments generated by restriction enzymes or by PCR, and it separates fragments across a range of roughly 100 bp to 25 kb. DNA fragments smaller than 100 bp are better resolved by polyacrylamide gel electrophoresis (PAGE), while fragments larger than 25 kb require pulsed-field gel electrophoresis (PFGE). Agarose gel electrophoresis can also separate other charged biomolecules such as RNA and proteins.
Principle
The separation medium is a gel made from agarose. Agarose is isolated from the red seaweed genera Gelidium and Gracilaria. It is a linear polysaccharide built from repeating agarobiose units, each a disaccharide of D-galactose and 3,6-anhydro-L-galactose. During gelation, agarose polymers associate non-covalently and form a network of bundles whose pore sizes determine a gel’s molecular sieving properties. In general, the higher the concentration of agarose, the smaller the pore size.
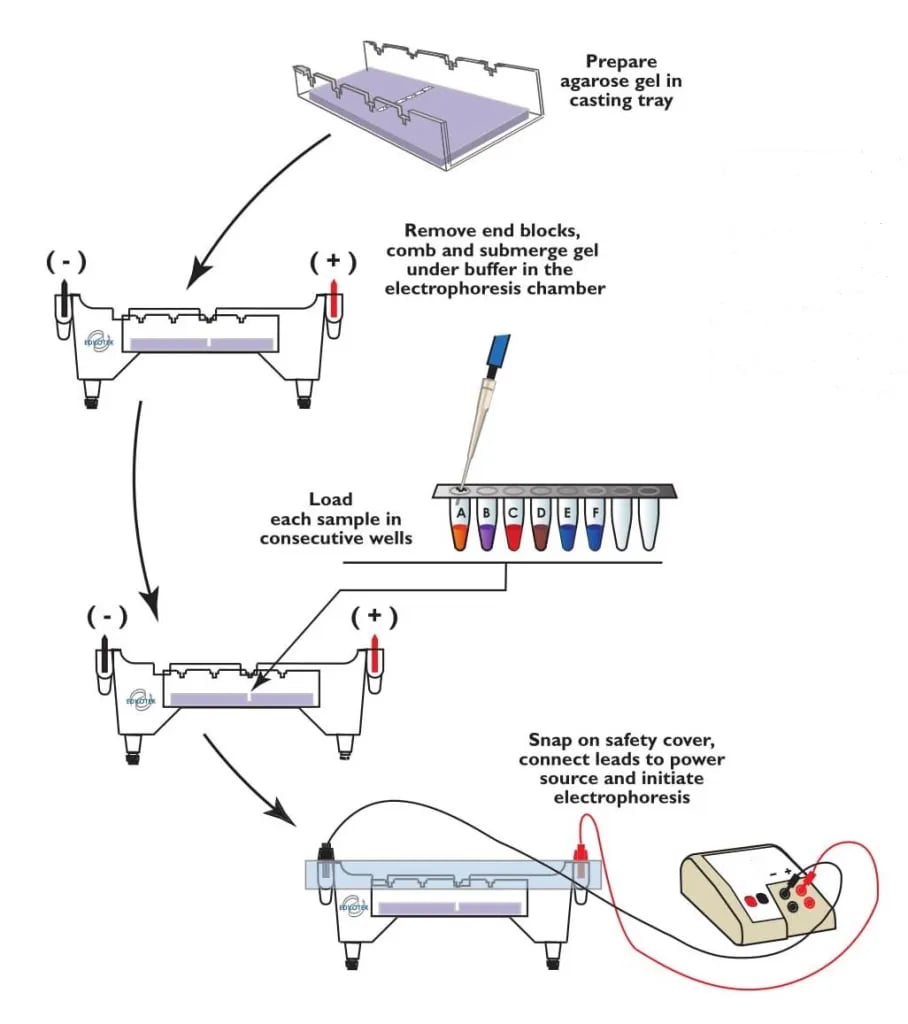 Figure: Agarose gel electrophoresis experiment overview (Image Source: Ref-2)
To separate DNA using agarose gel electrophoresis, the DNA is loaded into pre-cast wells in the gel and a current is applied. The phosphate backbone of the DNA (and RNA) molecule is negatively charged, therefore when placed in an electric field, DNA fragments will migrate to the positively charged anode. Because DNA has a uniform mass/charge ratio, DNA molecules are separated by size.
Factors affecting the migration of DNA
- Agarose concentration
The mobility of DNA decreases as the agarose concentration rises, because a higher percentage produces a tighter mesh. Higher percentage gels are sturdier and easier to handle, but molecules migrate more slowly through them and staining takes longer to penetrate. The concentration should be matched to the fragment size of interest: a low percentage gel spreads out large fragments, and a high percentage gel resolves small ones. A concentration of 0.8% is a common default for routine DNA separations, while 1% to 2% is used for smaller fragments.
- Size of DNA molecule
The sieving properties of the agarose gel influence the rate at which a molecule migrates. The separation occurs because smaller molecules pass through the pores of the gel more easily than larger ones. If the size of the two fragments is similar or identical, they will migrate together in the gel.
- DNA conformation
Two DNA molecules with the same number of base pairs can migrate at different rates if their shapes differ, because the gel sieves by effective size, not by base-pair count.
A single circular plasmid illustrates this well. Extracted plasmid DNA usually exists in three conformations, and on a gel they resolve into three bands even though every molecule contains the same number of base pairs:
Supercoiled plasmid is tightly wound and compact. It has the smallest effective radius and migrates fastest.
Linear DNA, produced when the circle is cut once, migrates at an intermediate rate.
Open circular (nicked) plasmid is a relaxed floppy loop with the largest effective radius. It snags in the mesh and migrates slowest.
Seeing three bands from one plasmid preparation is therefore normal, and not evidence of contamination.
For linear fragments, which is what a PCR product or a restriction digest gives you, migration is straightforward: the migration distance is inversely proportional to the log10 of fragment size in base pairs. The smaller the linear fragment, the further it travels.
- Applied voltage
Mobility of DNA molecules is also affected by the applied voltage. Within a range, the higher the applied voltage, the faster the sample migration.
Procedure of Agarose Gel Electrophoresis
Preparation of Agarose gel matrix
The centerpiece of agarose gel electrophoresis is the horizontal gel electrophoresis apparatus. The gel is made by dissolving agarose powder in a boiling buffer solution.
The concentration of agarose in a gel depends on the sizes of the DNA fragments to be separated, with most gels ranging between 0.5%-2%. The solution is then cooled to approximately 55°C and poured into a casting tray which serves as a mold. A well-former template (often called a comb) is placed across the end of the casting tray to form wells when the gel solution solidifies.
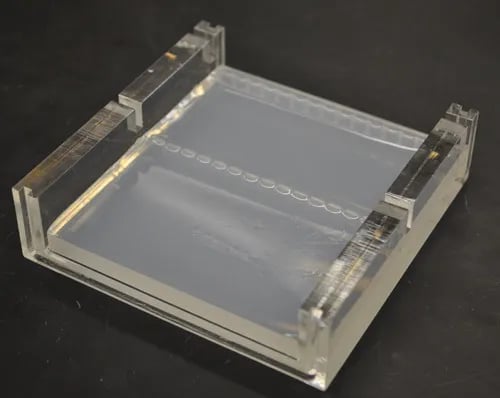 Figure: A solidified agarose gel after removal of the comb (Image Source: Ref-1)
After the gel solidifies, it is submerged in a buffer-filled electrophoresis chamber which contains a positive electrode (anode) at one end and a negative electrode (cathode) at the other. The buffer should cover the gel surface by roughly 2 to 5 mm. Too little buffer allows the gel to dry and overheat. Too much buffer allows current to shunt through the buffer layer above the gel rather than through the gel itself, which generates heat and blurs the bands.
The two common running buffers are TAE (1X: 40 mM Tris-acetate, 1 mM EDTA) and TBE (0.5X: 45 mM Tris-borate, 1 mM EDTA). They are not interchangeable. TAE has a lower buffering capacity and will exhaust during a long run, but it resolves large fragments well and leaves the DNA clean enough for downstream enzymatic work. TBE has a much higher buffering capacity and gives sharper resolution of small fragments, but borate inhibits many enzymes and carries over into DNA recovered from the gel. As a rule of thumb: use TAE if you intend to cut the band out and use the DNA, and TBE if you only need to look at it.
Sample preparation and loading
Samples are prepared for electrophoresis by mixing them with loading dyes. Gel loading dye is typically supplied at 6X concentration (0.25% bromophenol blue, 0.25% xylene cyanol, 30% glycerol). Loading dyes used in gel electrophoresis serve three major purposes:
- add density to the sample, so that it sinks to the bottom of the well rather than drifting out into the running buffer.
- provide color and simplify the loading process.
- the dyes move at standard rates through the gel, allowing for the estimation of the distance that DNA fragments have migrated.
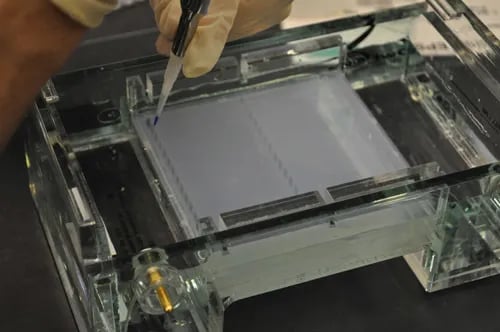 Figure: Loading the DNA sample into a well in the gel (Image Source: Ref-1)
These samples are delivered to the sample wells with a clean, adjustable-volume micropipette.
Ethidium bromide can be added to the gel during this step or alternatively, the gel may also be stained after electrophoresis in running buffer containing 0.5 μg/ml EtBr for 15-30 min, followed by destaining in running buffer for an equal length of time.
Applying electric current and separating biomolecules
A direct current (D.C.) power source is connected to the electrophoresis apparatus and an electrical current is applied. Charged molecules in the sample enter the gel through the walls of the wells. Molecules having a net negative charge migrate towards the positive electrode (anode) while net positively charged molecules migrate towards the negative electrode (cathode). The buffer serves as a conductor of electricity and controls the pH, which is important to the charge and stability of biological molecules. Since DNA has a strong negative charge at neutral pH, it migrates through the gel towards the positive electrode during electrophoresis.
The bluish-purple dye allows for visual tracking of sample migration during electrophoresis. The gel is run until the dye has migrated to an appropriate distance.
Results: How to Read an Agarose Gel
Visualization
The gel may be stained in either of two ways. Ethidium bromide can be added directly to the molten agarose before casting, so that DNA becomes visible while the run is still in progress. Alternatively, the gel is post-stained after electrophoresis, which gives a cleaner background because unbound dye has not been driven through the gel. The most commonly used stain for visualizing DNA is ethidium bromide (EtBr)
Alternative stains for DNA in agarose gels include SYBR Gold, SYBR Green, crystal violet, and methylene blue. Methylene blue and crystal violet are considerably less sensitive than ethidium bromide, but they are safer to handle and require no ultraviolet light. SYBR Gold and SYBR Green are highly sensitive and much safer than ethidium bromide, but they are more expensive.
EtBr works by intercalating itself in the DNA molecule in a concentration-dependent manner. When exposed to an ultraviolet light source (transilluminator), electrons in the aromatic ring of the ethidium molecule are activated, which leads to the release of energy (light) as the electrons return to the ground state. This allows for an estimation of the amount of DNA in any particular DNA band based on its intensity.
Ethidium bromide is a suspect mutagen and carcinogen, so it must be handled cautiously. It is hazardous waste and must be disposed of according to local regulations. Stains containing methylene blue are considered safer, but should still be handled and disposed of with care.
A second hazard is often overlooked, and it threatens the DNA rather than the operator. Short-wave ultraviolet light (254 nm) nicks DNA and induces thymine dimers. If a band is to be excised from the gel for cloning or sequencing, exposure must be kept to a minimum. Use a long-wave ultraviolet source or a blue-light transilluminator, and cut the band quickly rather than leaving the gel under the lamp.
The exact sizes of separated DNA fragments can be determined by plotting the log of the molecular weight for the different bands of a DNA standard (DNA ladder) against the distance traveled by each band. The DNA standard contains a mixture of DNA fragments of pre-determined sizes that can be compared against the unknown DNA samples.
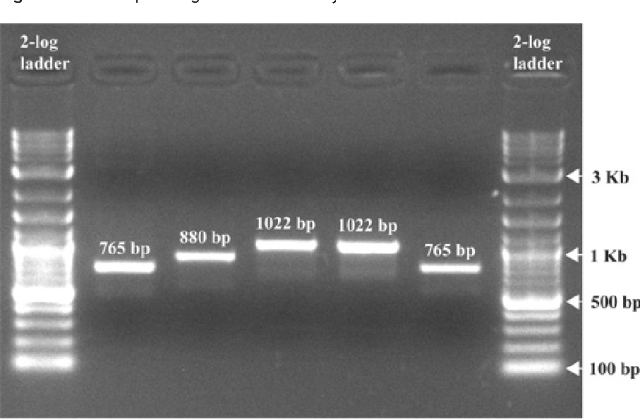 Figure: An image of a gel post electrophoresis (Image Source: Ref-1)
DNA concentrations can be estimated by
A. Taking absorbance at 260 nm. At 260 nm, an absorbance (A) of 1 unit corresponds to a concentration of:
- 50 μg/ml for dsDNA
- 40 μg/ml for RNA
- 33 μg/ml for ssDNA
- 20-30 µg/ml for oligonucleotides
Although this method is quick and nondestructive and gives information about the purity of the sample (e.g., presence of protein or organic contaminants), reliable estimates are obtained only with concentrations of at least 1 μg/ml. Additionally, this method cannot distinguish between DNA and RNA.
B. Intensity of Ethidium Bromide Fluorescence:
The amount of DNA in a sample can be estimated from the intensity of ethidium bromide fluorescence (fluorescence emitted by ethidium bromide is proportional to the amount of DNA). The DNA quantity in an “unknown” solution can be estimated by comparing its level of fluorescence with the intensity of known amounts of DNA of similar size. This method is useful if a DNA sample is contaminated with other compounds that absorb in the UV range or is too dilute to measure at 260 nm.
Reading a diagnostic PCR gel
A typical diagnostic gel carries four lanes, and each answers a different question.
The ladder is a mixture of fragments of known size, run alongside the samples. It converts height into base pairs. Without it, a band is just a band.
The negative control contains everything except template DNA. It must be empty. A band here means the reagents, the pipettes, or the air of the room carried contaminating DNA, and every other lane on the gel is now uninterpretable. This lane is checked first, before anyone looks at the patient.
The positive control contains known target DNA. It must show a band at the expected size. If it does not, the reaction failed, and a blank patient lane means nothing at all. An absent band is only a negative result when the positive control worked.
The patient lane is read last, and only against the other three.
What the common patterns mean:
| What you see | What it usually means |
|---|---|
| Sharp band at the expected size | Target amplified. The result you wanted |
| No band anywhere, including the positive control | Reaction failed. Check reagents, cycling, or the DNA template |
| No band in the patient lane, positive control good | A true negative for that target |
| Band in the negative control | Contamination. Discard the run, decontaminate, repeat |
| Band at the wrong size | Non-specific amplification. Primers annealed somewhere unintended |
| Multiple faint bands or a ladder-like smear of products | Non-specific priming. Raise the annealing temperature |
| A continuous smear in the sample lane | Degraded DNA, or gross overloading of the well |
| Bands curving or "smiling" across the gel | The gel overheated. Lower the voltage |
A note on the dyes. Loading dye is not just for colour. In a 1% agarose gel, bromophenol blue migrates at roughly the position of a 300 to 500 bp fragment, and xylene cyanol at roughly 4 kb. If your amplicon is 250 bp and the bromophenol blue front has reached the end of the gel, your product has already run off. Watch the dye, not the clock.
Key exam facts in one table
| Concept | Fact to retain |
|---|---|
| What agarose is | A linear polysaccharide from red seaweed (Gelidium, Gracilaria), built from repeating agarobiose units of D-galactose and 3,6-anhydro-L-galactose |
| Gel formation | Agarose is dissolved in boiling buffer, cooled to ~55°C, and poured. Polymers associate non-covalently into a bundled network whose pores act as a molecular sieve |
| Orientation | Horizontal ("submarine") gel, submerged in buffer. Contrast: PAGE is vertical |
| Direction of DNA migration | Toward the anode (positive electrode). The phosphate backbone is negatively charged at all working pH |
| Why size, not charge | DNA has a uniform charge-to-mass ratio. Charge sets direction; the sieving matrix sets separation |
| Migration and size | Migration distance is inversely proportional to log₁₀ of fragment size in base pairs |
| Agarose concentration | Higher % = smaller pores = better resolution of small fragments. Typical range 0.5% to 2%; 0.8% is a common default |
| Resolving range | Roughly 100 bp to 25 kb. Below this, use PAGE. Above this, use PFGE |
| Conformation order | Supercoiled (fastest) > linear > open circular/nicked (slowest) for the same plasmid |
| Running buffers | TAE (Tris-acetate-EDTA) and TBE (Tris-borate-EDTA) |
| TAE vs TBE | TAE: lower buffering capacity, better for large fragments, DNA recoverable for enzymatic work. TBE: higher buffering capacity, sharper small fragments, but borate inhibits enzymes |
| Buffer depth | Should cover the gel by about 2 to 5 mm. Excess buffer shunts current above the gel, causing heating and band blurring |
| Loading dye | Adds glycerol (density, so the sample sinks into the well), colour, and tracking dyes |
| Tracking dyes | Bromophenol blue ≈ 300 to 500 bp; xylene cyanol ≈ 4 kb, in a 1% gel |
| Standard stain | Ethidium bromide (0.5 µg/ml), an intercalating dye. Fluoresces under UV. A suspect mutagen and carcinogen |
| Safer stains | SYBR Gold, SYBR Green (sensitive, expensive); methylene blue, crystal violet (safer, less sensitive) |
| UV hazard to DNA | Short-wave UV nicks and dimerizes DNA. Use long-wave UV or a blue-light transilluminator if the band will be excised for cloning |
| A₂₆₀ = 1.0 corresponds to | 50 µg/ml dsDNA; 40 µg/ml RNA; 33 µg/ml ssDNA; 20 to 30 µg/ml oligonucleotides |
| Reading a gel | Negative control must be empty. Positive control must show a band. Only then is the patient lane interpretable |
| Key clinical use | Sizing a PCR amplicon against a ladder to confirm a pathogen when culture is sterile, for example after prior antibiotic therapy |
Where Students Get Confused
"Does agarose gel electrophoresis separate DNA by charge or by size?" By size. This trips people up because the whole thing runs on charge. Charge is what moves the DNA, and it moves every fragment toward the anode with the same force per unit mass, because adding a base pair adds charge and mass in fixed proportion. Charge therefore separates nothing. The gel mesh separates. If a question asks what agarose gel electrophoresis separates DNA by, the answer is size (and conformation), not charge.
"Why does my plasmid prep show three bands? Is it contaminated?" Almost certainly not. One plasmid can exist in three conformations, and they run at three different heights despite having identical base-pair counts. Supercoiled is tightly wound and compact, so it slips through the mesh fastest. Open circular (nicked) is a relaxed floppy loop with a large effective radius, and it snags, so it runs slowest. Linear sits in between. Three bands, one plasmid.
"So a higher percentage gel is a better gel?" Only for smaller fragments. Percentage sets pore size, and pore size should match your target. A 2% gel has a tight mesh that resolves a 200 bp fragment beautifully and leaves a 10 kb fragment stuck near the well. A 0.5% gel does the opposite. Choose the percentage from the fragment size, never the other way round.
"My PCR gel is blank. Is the patient negative?" You do not know yet. A blank patient lane is only a negative result if the positive control produced a band. If the positive control is also blank, the reaction failed, and the patient's lane carries no information. Equally, if the negative control shows a band, the run is contaminated and even a beautiful patient band cannot be trusted. Read the controls first, always.
"TAE or TBE, does it matter?" Yes, and the deciding question is what happens to the DNA next. If you are going to cut the band out of the gel and ligate, sequence, or digest it, use TAE, because borate from TBE carries over and inhibits enzymes. If you only need to look at the gel, especially at small fragments over a long run, use TBE, whose higher buffering capacity resists exhaustion and gives sharper small bands.
"The dye sinks into the gel, right?" It sinks into the well. Glycerol in the loading dye makes the sample denser than the running buffer above it, so the sample settles to the bottom of the well instead of drifting away into the tank. The gel is a solid. Nothing sinks into it.
"I cut my band out under UV and the cloning never works." Short-wave ultraviolet light nicks DNA and creates thymine dimers. The longer the gel sits on a 254 nm transilluminator, the more damaged the fragment you are about to clone. Use a long-wave UV source or a blue-light transilluminator, cut fast, and do not leave the gel sitting under the lamp while you find the scalpel.
"Why is my gel smiling?" Bands that curve upward at the edges mean the gel overheated during the run, usually because the voltage was too high or the buffer was exhausted or too deep. Heat is generated in proportion to current. Lower the voltage and accept a longer run.
References and further reading
- Lee PY, Costumbrado J, Hsu CY, Kim YH. Agarose gel electrophoresis for the separation of DNA fragments. Journal of Visualized Experiments. 2012;(62):3923. doi:10.3791/3923
- Green MR, Sambrook J. Molecular Cloning: A Laboratory Manual. 4th ed. Cold Spring Harbor, NY: Cold Spring Harbor Laboratory Press; 2012.
- Wilson K, Walker J. Principles and Techniques of Biochemistry and Molecular Biology. 8th ed. Cambridge: Cambridge University Press; 2018. Chapter: Electrophoretic Techniques.
- Westermeier R. Electrophoresis in Practice: A Guide to Methods and Applications of DNA and Protein Separations. 5th ed. Weinheim: Wiley-VCH; 2016.
Frequently Asked Questions
Does agarose gel electrophoresis separate DNA by size or by charge?
Why does DNA move toward the anode?
What size range can agarose gel electrophoresis resolve?
Why does my plasmid preparation show three bands on the gel?
How do I choose the agarose concentration?
What is the difference between TAE and TBE buffer?
What is a DNA ladder and why is it needed?
My PCR gel shows no band in the patient lane. Is that a negative result?
What do the dyes in the loading buffer do?
Is ethidium bromide dangerous, and what can be used instead?

Tankeshwar Acharya, MSc (Medical Microbiology)
Tankeshwar Acharya is an Assistant Professor in the Department of Microbiology at Patan Academy of Health Sciences (PAHS), Nepal, where he has been teaching and practicing clinical microbiology for over 14 years. He is the founder of Microbe Online, one of the leading free microbiology education resources on the web, covering bacteriology, mycology, parasitology, immunology, and clinical laboratory diagnostics written from direct experience in both the classroom and the diagnostic laboratory.